|
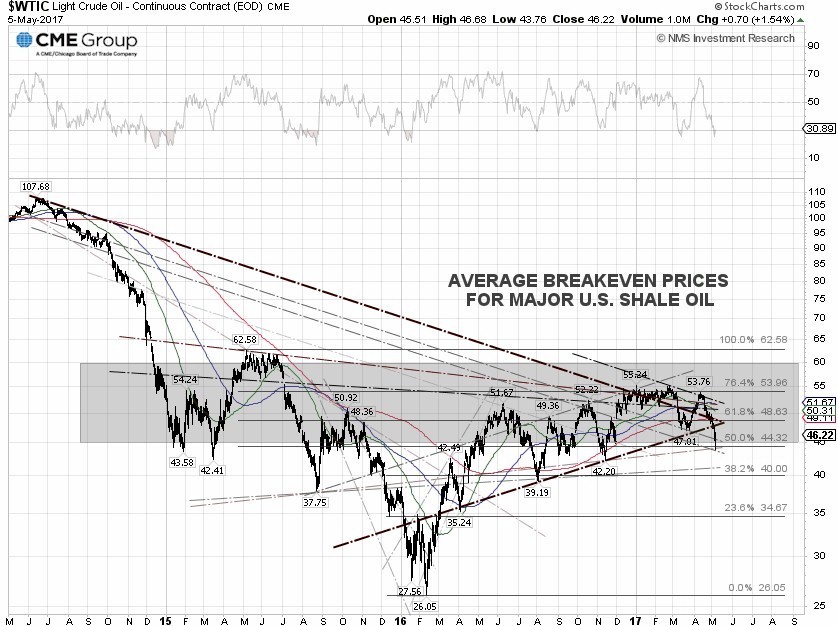
The WTI crude spot price tumbled 6.30% for the week, closing at $46.22 per barrel on Friday, while the Brent crude spot price lost 4.78% to close at $49.45 per barrel. The benchmarks went through a flash crash intraday Friday as they traded as low as $43.76 and $46.64 per barrel, respectively, before bouncing back after Saudi Arabia's OPEC Governor Adeeb Al-Aama told Reuters that OPEC and non-OPEC members were close to an agreement for a six-month extension of a production cut of 1.8 million barrels a day, or bpd, which began on January 1 and was supposed to end on June 30.
According to Reuters, managed futures firms, also known in U.S. financial regulatory terms as Commodity Trading Advisors, or CTAs, which manage about $340 billion in assets, were selling crude oil futures contracts this week following multiple signs of a trend change across all commodities including iron ore, gold and copper prices. The WTI crude price bounced off the $44.32 level, or 50% Fibonnaci retracement, but the downtrend persists as the symmetrical triangle chart pattern is broken and a descending channel has now emerged. The next technical support is at the $40 level, or 38.2% Fibonnaci retracement.
The EIA monthly reports for U.S. crude oil imports and exports, released last Friday, showed that the U.S. crude oil imports in February declined 0.3% year-on-year to 7.89 million barrels per day, or bpd, while exports skyrocketed 198.3% to 1.12 million bpd. Since the beginning of this year, U.S. crude oil exports have risen 0.67 million bpd, compared to the OPEC and non-OPEC combined output cut of 1.8 million bpd.
From our viewpoint, U.S. crude oil exports could fill the OPEC supply gap in less than 6 months if the trend continues. According to the EIA, U.S. net imports shrunk over 10% year-on-year in February to 6.77 million bpd, while the U.S. net consumption of crude oil dropped about 8% year-on-year to 17.74 million bpd. The data suggests that U.S. demand for crude oil may have been shrinking since the beginning of the year.
The Crude Oil Volatility Index, or OVX, traded on the Chicago Board Options Exchange, or CBOE, surged 4.04% on Friday to an intraday high of 36.07, but pulled back to close at 33.83, just below the 200-day SMA. A breakout could send the OVX back to retest the trendline resistance at about 42, meaning more selling for crude oil. The index has been trading under the 200-day SMA since April 2016. The OVX is a crude oil derivative which measures the market’s expectation of 30-day volatility of the United States Oil Fund ETF (NYSE:USO), primarily the near month WTI crude oil futures contracts traded on the NYMEX. In short, high OVX readings usually mean traders see significant risks that crude oil price futures will move sharply lower.
The EIA weekly U.S. oil inventory report on Wednesday showed that domestic crude supplies declined by 930,000 barrels to 527.77 million barrels, excluding the Strategic Petroleum Reserve, in the week ending April 28, compared to the S&P Global Platts forecast for a stockpile decline of 2.25 million barrels. The American Petroleum Institute, or API, inventory data on Tuesday showed a U.S. crude inventory draw of 4.2 million barrels.
Separately, the EIA said the weekly U.S. crude oil production increased another 28,000 bpd, for the week ending April 28, to 9.29 million bpd. U.S. crude oil output increased 127,000 bpd to an average of 9.26 million bpd in April, compared to a March average of 9.13 million bpd. Output has fallen just 3.53% from the peak level of 9.60 million bpd in June 2015. Houston-based oilfield services company Baker Hughes Inc. said on Friday that the U.S. oil rig count rose another 6 to 703, compared to 316, when the rig count hit the low on June 6, 2016.
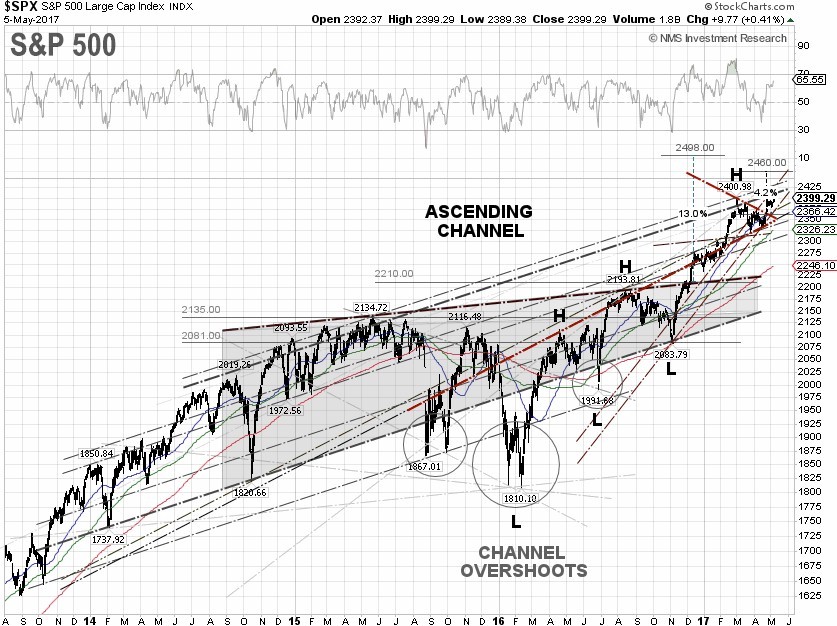
S&P 500 Summary: +7.17% YTD as of 05/05/17
Barclay Hedge Fund Index: +3.72% YTD
Outperforming Sectors: Information technology +16.47 YTD, Consumer discretionary +10.76% YTD, Healthcare +10.12% YTD, and Materials +7.47% YTD.
Underperforming Sectors: Industrials +6.73% YTD, Consumer staples +6.63% YTD, Utilities +6.29% YTD, Real Estate +2.97% YTD, Financials +2.31% YTD, Telecommunication services –10.28% YTD, and Energy –10.65%
YTD. |