S&P 500

S&P 500 Pulled Back For The Week After American Media Pounds Trump With Negative Commentaries

Ed Wijaranakula, Ph.D.
Fri May 12, 2017

The S&P 500 lost 0.35% for the week, to close on Friday at 2,390.90, after the American media pounded President Trump over the firing of FBI Director James Comey earlier in the week. CNN and MSNBC are now talking about a President Trump impeachment. Here's the McClatchy headline on May 10, “Comey firing means trouble for Trump’s health care and tax plans”. “Trump's firing of Comey endangers his entire presidency”, wrote CNBC's John Harwood. The problem for investors is how to distinguish American media fact from fiction. The latest second-quarter GDP 2017 forecast by the Federal Reserve Bank of New York is just 1.88%. If it becomes worse from here, one can then blame the American media for tanking the U.S. economy.

The best performing sector for the week continues to be Information technology ($SPT), up 1.13%, after Wall Street analysts commented that Apple (NASDAQ:AAPL) is poised to become a $1 trillion company. It was also reported that Warren Buffet doubled his stake in Apple and now owns nearly $17 billion worth of AAPL. The worst performing sectors for the week were Materials ($SPM) and Financials ($SPF), down 1.68% and 1.27%, respectively, as the sectors became collateral damage from negative headline news.

The Job Openings and Labor Turnover Survey, or JOLTS, data carefully watched by Fed Chair Janet Yellen, reported monthly by the U.S. Department of Labor, came in on Tuesday at 5.743 million openings for March, down 1.86% year-on-year. There is more bad news as the first-quarter 2017 JOLTS is also down 0.47% year-on-year, the first negative reading since the second-quarter 2010. Although JOLTS is not one of the recession indicators, from the historical perspective, however, the U.S. economy went into a recession in the first-quarter 2008 after the fourth-quarter 2007 and first-quarter 2008 JOLTS were negative. 

The U.S. Commerce Department said on Friday that April retail sales came in at 0.4% month-over-month, missing economists’ expectations of a 0.5% gain. Meanwhile, the University of Michigan reported that its consumer confidence index registered at 97.7 in May, barely beating expectations of 97.2. 

The spot gold price remained practically unchanged for the week, up $0.80 per ounce at $1,227.70 per ounce on Friday. The U.S. dollar index, or DXY, gained 0.61% for the week, closing at 99.13 on Friday, while the Japanese yen depreciated 0.61% against the U.S. dollar at 113.34 yen. The U.S. dollar was rejected from the trendline resistances, but managed to close above the 200-day SMA after Emmanuel Macron won the French presidential election in a landslide on Sunday. 

The yield of 10-year U.S. Treasury Notes was down 1.27% for the week, to close on Friday at 2.33%, while the yield of the 2-year Notes lost 2.27% to close at 1.29%. The yield spread between the 10-year and 2-year U.S. Treasury Notes was unchanged at 1.04 percentage points.

The WTI crude oil spot price jumped over 3.5% for the week to close on Friday at $47.84 per barrel, while the Brent crude spot price gained 2.81% to close at $50.84 per barrel, after the EIA weekly report for U.S. oil inventory showed that domestic crude supplies declined by 5.25 million barrels to 522.53 million barrels, excluding the Strategic Petroleum Reserve, in the week ending May 5, compared to the S&P Global Platts forecast for a stockpile decline of 1.8 million barrels. The American Petroleum Institute, or API, inventory data on Tuesday showed a U.S. crude inventory draw of 5.8 million barrels. The net imports for crude oil in the week ending May 5, was 6.93 million barrels per day, or bpd, down 799,000 bpd compared to the previous week, as crude imports dropped 644,000 bpd while exports surged 155,000 bpd.

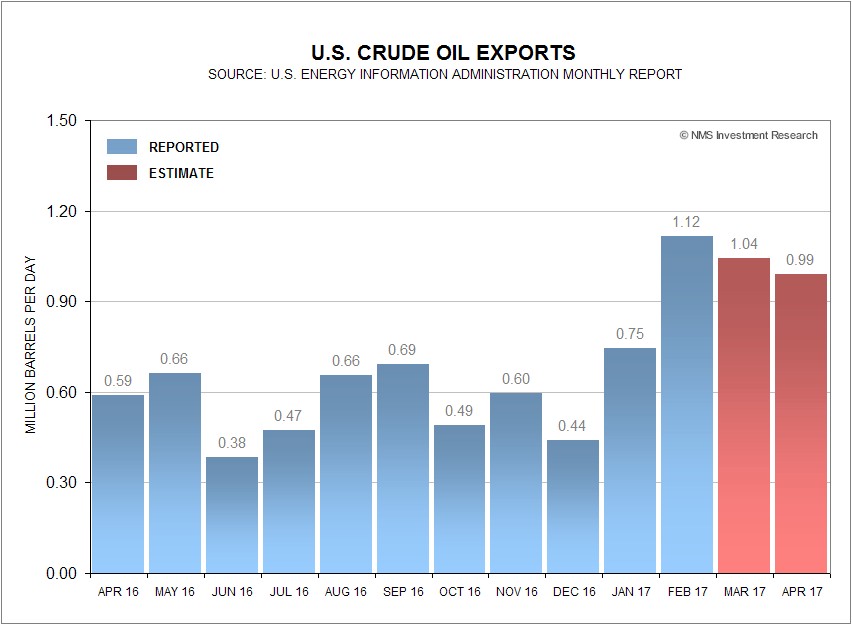
The EIA monthly reports for U.S. crude oil imports and exports, released at the end of April, showed that the U.S. crude oil imports in February declined 0.3% year-on-year to 7.89 million bpd, while exports skyrocketed 198.3% to 1.12 million bpd. Based upon our estimation, U.S. crude oil exports could stay near 1 million bpd in March and April, making the OPEC production cuts to ease the glut near term less likely. The EIA monthly reports for March 2017 is due on May 31.

Separately, the EIA said the weekly U.S. crude oil production increased another 21,000 bpd, for the week ending May 5, to 9.31 million bpd. U.S. crude oil output increased 53,000 bpd to an average of 9.31 million bpd in May, compared to an April average of 9.26 million bpd. Output has fallen just 2.98% from the peak level of 9.60 million bpd in June 2015. Houston-based oilfield services company Baker Hughes Inc. said on Friday that the U.S. oil rig count rose another 9 to 712, compared to 316, when the rig count hit the low on June 6, 2016.

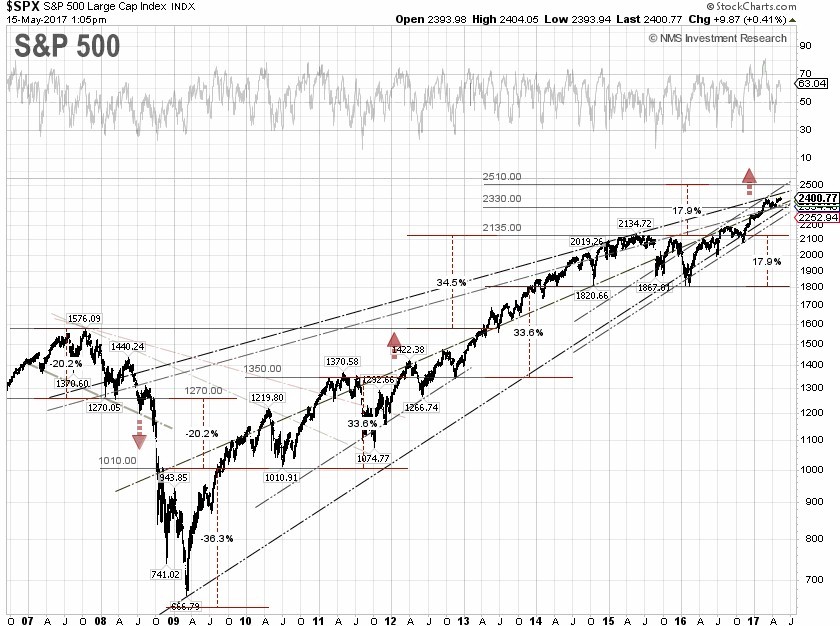
S&P 500 Summary: +6.79% YTD as of 05/12/17 
Barclay Hedge Fund Index: +3.57% YTD 

Outperforming Sectors: Information technology +17.78 YTD, Consumer discretionary +10.39% YTD, and Healthcare +9.07% YTD.

Underperforming Sectors: Consumer staples +6.07% YTD, Utilities +6.02% YTD, Materials +5.66% YTD, Industrials +5.48% YTD, Real Estate +1.68% YTD, Financials +1.01% YTD, Energy –10.31% YTD, and Telecommunication services –10.85% YTD.

S&P 500 ANALYSIS

Most Recent Articles  |  Older Articles            

 Infotix Systems, Inc. - NMS (Not Main Street) Research - privacy & security policy
All rights reserved