S&P 500

S&P 500 Broke Out, With Near-Term Objective Target At 2,480 Despite Disappointing First-Quarter GDP 2017

Ed Wijaranakula, Ph.D.
Fri Apr 28, 2017

The S&P 500 gained another 1.51% for the week, to close on Friday at 2,384.20, led by Information technology ($SPT) and Healthcare ($SPHC), up 2.62% and 2.43%, respectively. The worst performing sectors for the week were Real Estate ($SPRE) and Telecommunication services ($SPTS), down 2.04% and 1.47%, respectively. 

The index had broken out earlier in the week, with an objective target at 2,480, following the French election results over the weekend showing that pro-European reformer Emmanuel Macron emerged as the front runner to become the next president of France. The market, however, didn't know what to make of the Trump administration's one-page tax reform plan, so-called “the biggest tax cut” in U.S. history, that was released on Wednesday.

The ECB left key interest rates on hold on Thursday, including the deposit rate at minus 0.4%, and 60 billion euros of corporate and government bond buying per month until December, inline with most analysts' expectations. The market expects ECB President Mario Draghi, however, to act after May 7, when the second round of elections in France is over. Meanwhile, the BOJ also decided to keep its policy unchanged on Thursday, as expected, meaning the short-term interest rate target at minus 0.1% and the government bond buying program at an annual pace of 80 trillion yen. Analysts believe that Governor Haruhiko Kuroda will keep the policy unchanged until his term expires next spring.

The U.S. Department of Commerce released its advance estimate first-quarter 2017 GDP of $16.84 trillion on Friday, a compounded annual growth rate, or CAGR, of 0.69%, well below Wall Street's estimate of 1.0% growth. The Federal Reserve Bank of Atlanta was expecting the first-quarter 2017 GDP to grow just 0.2%, though. The Federal Reserve Bank of New York's forecast was way off, as they saw the economy to grow at a 2.7% pace for first-quarter 2017. The U.S. economy has been bouncing along the bottom since the Fed began their rate hike campaign in the fourth-quarter 2015. Not many people are aware that the third-quarter 2016 GDP of 3.5% was an outlier, due to a surge in U.S. soybean exports after a poor harvest in Argentina and Brazil. 

The yield of 10-year U.S. Treasury Notes was up 2.23% this week, to close on Friday at 2.29%, while the yield of the 2-year Notes surged 3.23% for the week, to close on Friday at 1.28%. The yield spread between the 10-year and 2-year U.S. Treasury Notes shrunk 2.88% to 1.01 percentage points. The spot gold price closed down 1.61% for the week, at $1,268.30 per ounce on Friday. The U.S. dollar index, or DXY, was down 0.98% for the week, closing at 98.90 on Friday, while the Japanese yen depreciated 2.10% against the U.S. dollar at 111.44 yen.

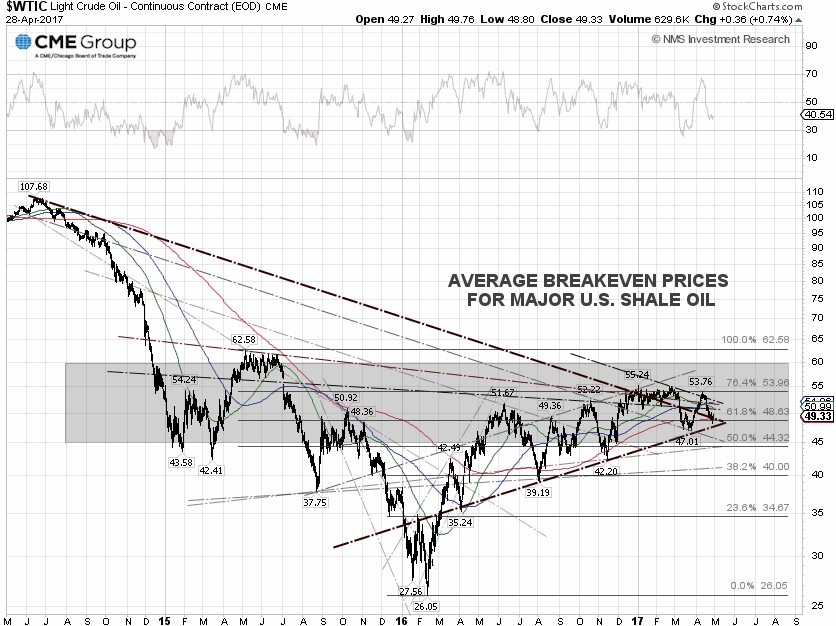
The WTI crude spot price was lower 0.58% for the week, closing at $49.33 per barrel on Friday, while the Brent crude spot price was practically unchanged to close at $51.93 per barrel, despite a bullish EIA weekly report. Traders were focusing last week on gasoline and distillate stockpiles, which rose sharply to 3.4 and 2.7 million barrels, respectively. The S&P Global Platts survey had forecasted declines of 1.1 million barrels for gasoline and 1.8 million barrels for distillates.

The EIA weekly U.S. oil inventory report on Wednesday showed that domestic crude supplies declined by 3.641 million barrels to 528.702 million barrels, excluding the Strategic Petroleum Reserve, in the week ending April 21, compared to the S&P Global Platts forecast for a stockpile decline of 1 million barrels. The American Petroleum Institute, or API, inventory data on Tuesday showed a U.S. crude inventory increase of 0.897 million barrels. 

Separately, the EIA said the weekly U.S. crude oil production increased 13,000 barrels per day, or bpd, for the week ending April 17, to 9.265 million bpd. U.S. crude oil output increased 116,000 bpd to an average of 9.251 million bpd in April, compared to a March average of 9.134 million bpd. Output has fallen just 3.64% from the peak level of 9.60 million bpd in June 2015. Houston-based oilfield services company Baker Hughes Inc. said on Friday that the U.S. oil rig count rose another 9 to 697, compared to 316, when the rig count hit the low on June 6, 2016.

S&P 500 Summary: +6.49% YTD as of 04/28/17 
Barclay Hedge Fund Index: +3.00% YTD 

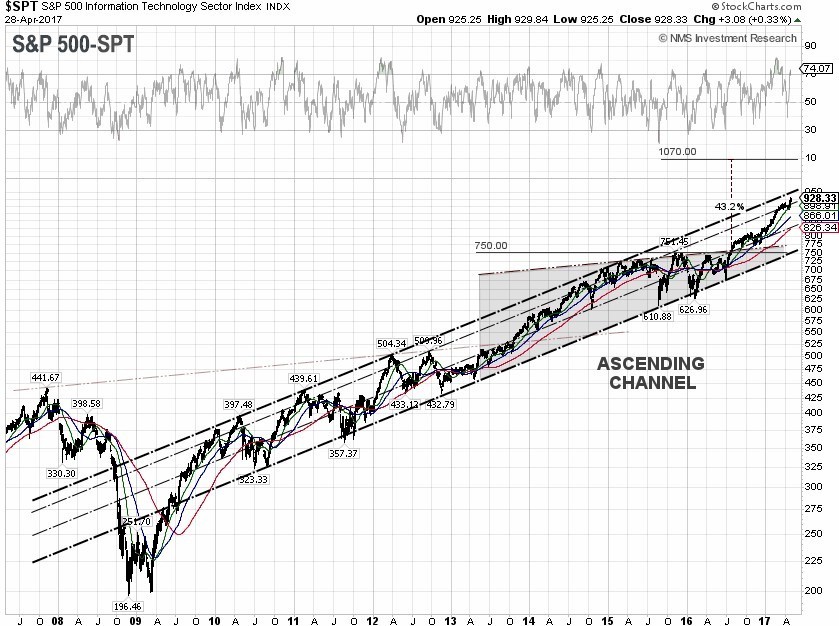
Outperforming Sectors: Information technology +14.90 YTD, Consumer discretionary +10.64% YTD, Healthcare +9.46% YTD, Materials +6.73% YTD, and Consumer staples +6.53% YTD.

Underperforming Sectors:, Utilities +6.21% YTD, Industrials +5.78% YTD, Real Estate +2.70% YTD., Financials +1.09% YTD, Telecommunication services –9.22% YTD, and Energy –10.02% YTD.

S&P 500 ANALYSIS

Most Recent Articles  |  Older Articles            

 Infotix Systems, Inc. - NMS (Not Main Street) Research - privacy & security policy
All rights reserved