|
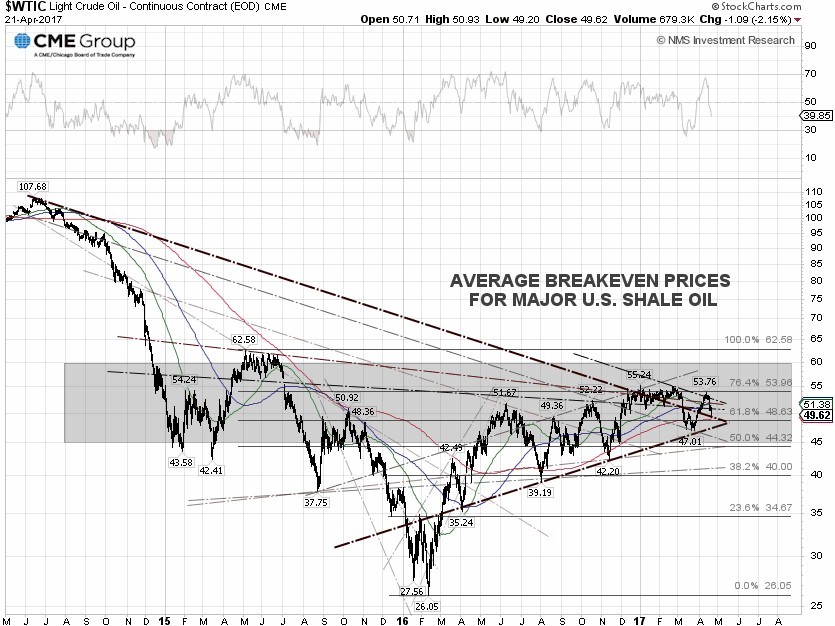
The WTI crude spot price tumbled 6.69% for the week, closing at $49.62 per barrel on Friday, while the Brent crude spot price was down 6.68% to close at $51.95 per barrel, despite a bullish EIA weekly report. It was a volatile week, as the WTI May'17 crude oil futures contract expired on April 20, when traders had to swap those contracts for the June'17 crude oil futures contracts. The WTI crude price is now testing the long-term trendline support of the symmetrical triangle chart pattern and may bounce from there. The next support for WTI crude is $48.63 per barrel, or 61.8% Fibonacci retracement, if the trendline support can't hold.
Not many people are aware that the Trump administration issued its first certification of Iran's compliance with the nuclear agreement and sent it to Congress on Tuesday night before the deadline, meaning Iran can continue pumping their oil for another 90 days until the next certification is due. President Donald Trump ordered a review of whether lifting sanctions against Iran was in the United States' national interests. But, the move will probably not stop Iran from continue to pump their oil and exporting it elsewhere.
Iran produces about 3.8 million barrels per day, or bpd, allowed under the deal in the first-quarter, according to the International Energy Agency. Iran, Libya and Nigeria are the three OPEC countries that are exempt from the output cut.
Crude oil prices continued to slide despite a Reuters report on Friday that a OPEC and non-OPEC technical committee recommended extending cuts of 1.8 million bpd for another 6 months, to be discussed at the upcoming May 25 meeting. The market may be casting doubt that the cut extension proposal will go through.
The EIA weekly U.S. oil inventory report on Wednesday showed that domestic crude supplies declined by 1.03 million barrels to 532.343 million barrels, excluding the Strategic Petroleum Reserve, in the week ending April 14, compared to the S&P Global Platts forecast for a stockpile decline of 50,000 barrels. The American Petroleum Institute, or API, inventory data on Tuesday showed a U.S. crude inventory decline of 0.84 million barrels.
Separately, the EIA said the weekly U.S. crude oil production increased 17,000 bpd, for the week ending April 14, to 9.252 million bpd. U.S. crude oil output increased 109,000 bpd to an average of 9.244 million bpd in April, compared to a March average of 9.134 million bpd. Output has fallen just 3.71% from the peak level of 9.60 million bpd in June 2015. Houston-based oilfield services company Baker Hughes Inc. said on Friday that the U.S. oil rig count rose another 5 to 681, compared to 316, when the rig count hit the low on June 6, 2016.
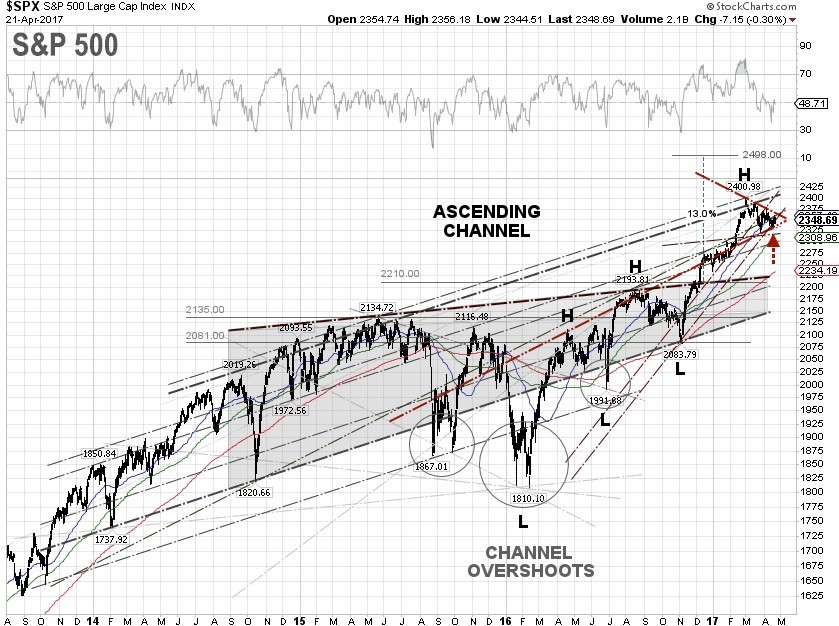
S&P 500 Summary: +4.91% YTD as of 04/21/17
Barclay Hedge Fund Index: +3.00% YTD
Outperforming Sectors: Information technology +11.97 YTD, Consumer discretionary +8.42% YTD, Healthcare +6.86% YTD, Utilities +6.36% YTD, and Consumer staples +6.19% YTD.
Underperforming Sectors: Materials +4.87% YTD, Real Estate +4.84% YTD. Industrials +4.46% YTD,, Financials –0.48% YTD, Telecommunication services –7.86% YTD, and Energy –10.09%
YTD. |