|
In the fiscal 2015 first quarter ended December 2014, Apple [NASDAQ:AAPL] reported total revenues of $74.6 billion, up 30% year-over-year and EPS of $3.06, up 48% year-over-year. Wall Street was expecting earnings of $2.60 per share on revenue of $67.7 billion. Sales were up across all products and services, except iPads. A total of 21.4 million iPads were sold last quarter, down 17.7% year-over-year.
There is no real concern yet at Apple headquarters in Cupertino, CA as Tim Cook, Apple’s CEO, put it during the company's earnings call in September, “Some people might come into the Apple store and look at buying an iPad and a Mac, and opt for the iPad or some people look at the iPhone and the iPad, and opt for the iPhone”.
Apple sold a total of 74.4 million iPhones last quarter, up from 51 million, or 45.9%, from the same period a year ago. Analysts were expecting iPhone sales of 66.2 million units. It seems like it worked out fine for Apple though, if iPad sales were being cannibalized by the iPhone 6 Plus.
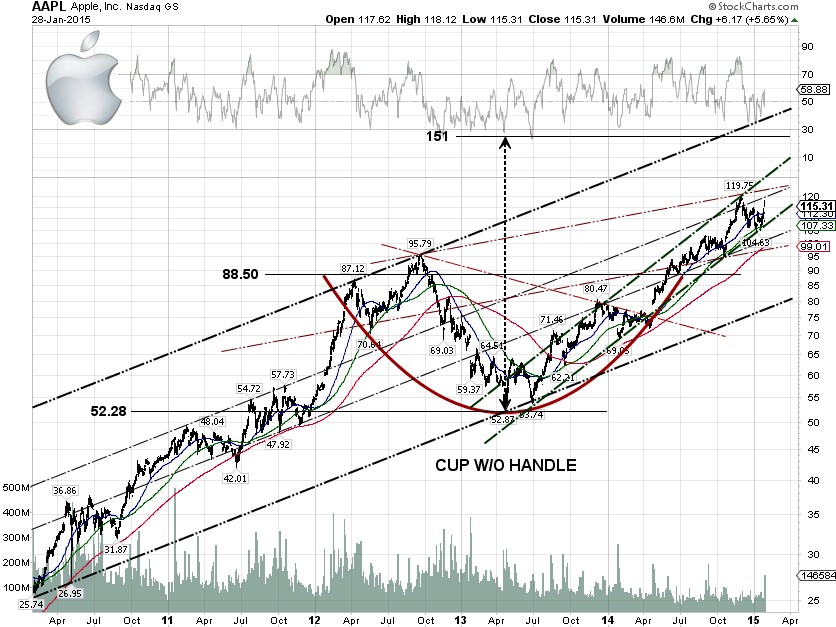
In the 5-year stock chart, the AAPL chart pattern completed a cup shape in June 2014 with the base at $88.50 and bottom at $52.28, giving a cup base depth of about 30%. Most cups come with a handle, or a smaller correction within the base, that serves as a last shakeout before the stock surges to new highs.
Many technicians expected the stock to pull back in July 2014. Nonetheless, a stock pull back did not materialize as institutional investors and a long list of hedge funds were taking long positions in AAPL while getting out of Google’s stock [NASDAQ:GOOGL]. From the cup without handle model, our price projection for AAPL is $151.
Disclosure: Long Position AAPL in Portfolio |