S&P 500

S&P 500 Continues To Wobble As Disappointing U.S. Economic Data Starts Piling Up

Ed Wijaranakula, Ph.D.
Fri Apr 7, 2017

The S&P 500 lost 0.3% for the week, to close on Friday at 2,355.54, following a series of worse-than-expected economic data that was reported this week, including ISM manufacturing and non-manufacturing, construction spending, auto sales, and the March nonfarm payrolls report. The index has been wobbling for the past five weeks as it struggles under the trendline resistance. The best performing S&P 500 sectors for the week were Real Estate ($SPRE) and Energy ($SPEN), up 0.63% and 0.61%, respectively. The worst performing sectors for the week were Telecommunication service ($SPTS), Financials ($SPF), and Consumer discretionary ($SPCC), down 1.10%, 0.98%, and 0.82%, respectively.

The minutes of the Fed's March 14-15 FOMC meeting, released on Wednesday, revealed that Fed officials became less enthusiastic about the Trump administration's fiscal stimulus plans. The minutes said, “several participants now anticipated that meaningful fiscal stimulus would likely not begin until 2018. In view of the substantial uncertainty, about half of the participants did not incorporate explicit assumptions about fiscal policy in their projections.”

The U.S. Department of Labor reported on Friday that total nonfarm payrolls increased by 98,000 in March to a total of 145.858 million, compared to a revised 145.760 million in February, significantly lower than economists’ expectations for 185,000 jobs added. Some economists blame the bad weather during the sample week of the report. The U.S. unemployment rate ticked down to 4.5%, while the civilian labor force participation rate remains at 63.0%, meaning some 94.21 million Americans are not in the labor force, from Employment Situation Summary Table A-1: Household data, seasonally adjusted.

The number of people who are not in the labor force but currently want a job, increased to 5.78 million in March from 5.60 million registered in February. The average hourly earnings of all employees on private nonfarm payrolls increased by $0.05 per hour on month-over-month basis to $26.14 per hour in March and by $0.68 per hour year-on-year. The key takeaways from the March nonfarm payrolls report are that job growth continues to taper while average hourly earnings growth is stalling at around 2.7%.

The U.S. Dollar index, or DXY, essentially the USD/EUR exchange rate, closed at 101.12 on Friday, up another 0.90% for the week, despite weak U.S. economic data and the disappointing March nonfarm payrolls report. Currency speculators ran up the U.S. dollar and sold the British pound after Bank of England, or BOE, Governor Mark Carney hinted at the possibility of a “hard Brexit” scenario at his speech at Thomson Reuters in London on Friday. To make matters worse on Friday, UK industrial production and manufacturing output came in short of expectations for February, contracting 0.7% and 0.1% for the month, respectively.

William C. Dudley, President of the Federal Reserve Bank of New York added fuel to the dollar fire after he said during Q&A at a luncheon in New York City on Friday that the Federal Reserve might in the future avoid raising interest rates at the same time that it begins the process of shrinking its $4.5 trillion bond portfolio, prompting only a "little pause" in the central bank's rate hike plans.

The Federal Reserve Bank of Atlanta revised its U.S. first-quarter 2017 GDP forecast on Friday to 0.6% from the previous 1.2%, citing weak auto sales, the ISM Non-Manufacturing Report, the March nonfarm payrolls report, among other data. Separately, the Federal Reserve Bank of New York still remains optimistic and trimmed its U.S. first-quarter GDP forecast by only 0.1 percentage point on Friday to 2.8%. The average forecast for first-quarter 2017 growth from both the Atlanta Fed and the New York Fed now stands at 1.7%, inline with the consensus Wall Street forecast. The U.S. Department of Commerce will release its advance estimate first-quarter 2017 GDP on April 28. 

The yield of 10-year U.S. Treasury Notes ticked down 0.83% this week, to close on Friday at 2.38%, while the yield of the 2-year Notes jumped 1.57% for the week, to close on Friday at 1.29%. The yield spread between the 10-year and 2-year U.S. Treasury Notes tumbled 3.54% to 1.09 percentage points. The spot gold price gained 0.49% for the week, to close at $1,257.30 per ounce on Friday, while the Japanese yen appreciated 0.26% against the U.S. dollar at 111.09 yen.

The WTI crude spot price surged 3.24%, closing at $52.24 per barrel on Friday, while the Brent crude spot price was up 2.93% to close at $55.19 per barrel, despite another bearish EIA weekly report. It sounds like Goldman Sachs is backstopping WTI crude prices, when the firm sent out a research note on Wednesday saying that with global demand exceeding supply, they are "constructive" on oil prices, at least in the short term. Goldman said, "We project WTI will increase from $50/bbl to $57.50/bbl by mid-year and average of $55/bbl in “the second half of 2017", according to Barrons.

Just about two weeks ago, on March 21, Goldman Sachs sent out a research note saying that 2017-19 is likely to see the largest increase in history for mega projects' production, as the record 2011-13 capex commitment yields fruit, meaning a possible record for non-OPEC production growth in 2018. The WTI crude spot price tumbled 1.37% that day to $48.24 per barrel, below the 200-day SMA. Crude oil prices were also given a boost after the U.S. launched cruise missiles at a Syrian base on Thursday, in response to a chemical weapons attack in Syria that killed more than 100 civilians earlier in the week.

The EIA weekly U.S. oil inventory report on Wednesday showed that domestic crude supplies increased by 1.57 million barrels to an all-time high of 535.54 million barrels, excluding the Strategic Petroleum Reserve, in the week ending March 31, compared to the Wall Street Journal forecast for a stockpile decline of 0.2 million barrels. The American Petroleum Institute, or API, inventory data on Tuesday showed a U.S. crude inventory decline of 1.8 million barrels. 

Separately, the EIA said the weekly U.S. crude oil production increased 52,000 barrels per day, or bpd, for the week ending March 31, to 9.199 million bpd. U.S. crude oil output increased 137,000 bpd to an average of 9.134 million bpd in March, compared to a February average of 8.997 million bpd. Output has fallen just 4.85% from the peak level of 9.60 million bpd in June 2015. Houston-based oilfield services company Baker Hughes Inc. said on Friday that the U.S. oil rig count rose another 10 to 672, compared to 316, when the rig count hit the low on June 6, 2016. 

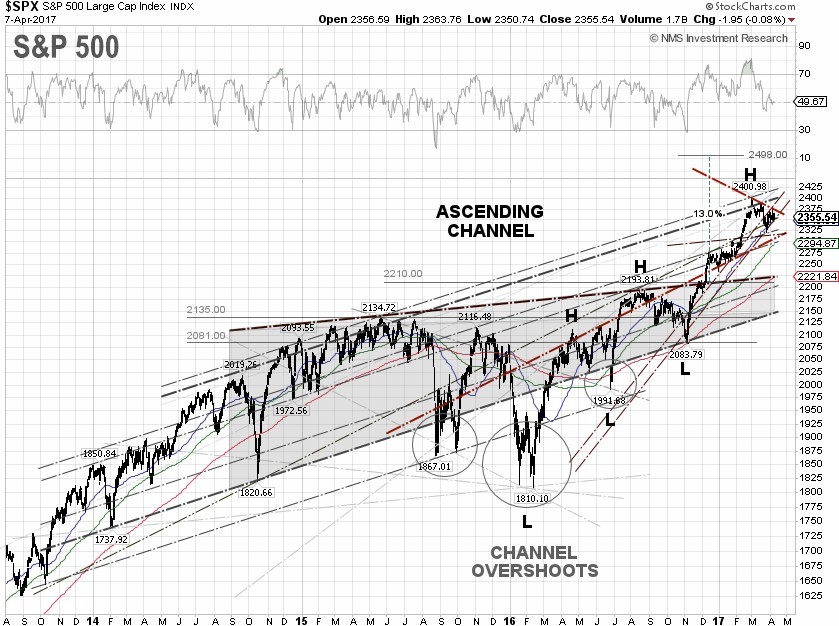
S&P 500 Summary: +5.21% YTD as of 04/07/17 
Barclay Hedge Fund Index: +2.75% YTD 

Outperforming Sectors: Information technology +11.51 YTD, Healthcare +7.90% YTD, Consumer discretionary +7.21% YTD, Consumer staples +5.77% YTD, Materials +5.63% YTD, and Utilities +5.62% YTD.

Underperforming Sectors: Industrials +4.08% YTD, Real Estate +3.37% YTD, Financials +1.08% YTD, Telecommunication services –6.10% YTD, and Energy –6.74% YTD.

S&P 500 ANALYSIS

Most Recent Articles  |  Older Articles            

 Infotix Systems, Inc. - NMS (Not Main Street) Research - privacy & security policy
All rights reserved