S&P 500

Fed September Rate Hike, if Any, Has to be Based Upon Something Else Besides Nonfarm Payrolls and Core PCE Data

Witawat (Ed) Wijaranakula, Ph.D.
Fri Sep 2, 2016

The S&P 500 closed at 2,179.98 on Friday, up 0.50% for the week, as weakness in the Healthcare and Energy sectors were offset by strength in the Financials and Materials sectors. Hillary Clinton and the Democrats continued their attacks on U.S. healthcare. On Friday, Clinton unveiled a new plan to create government watchdogs to monitor drug price increases, while 20 Democratic U.S. senators, including Elizabeth Warren and Bernie Sanders, sent an open letter on Tuesday to Mylan (NASDAQ:MYL) criticizing its “exorbitantly expensive” EpiPen price hikes. 

The S&P 500 Healthcare and Biotechnology sectors are among the worst performers this year. Renaissance Capital just published a recap of 2016 IPOs and things did not look good for the healthcare IPO companies. As investors are spooked by the political rhetoric, financial investments in research and development of innovative medications and treatments will be at risk down the road. 

Two important economic data reports that the Fed depends upon, nonfarm payrolls and core personal consumption expenditures (PCE), were released this week. The U.S. Bureau of Economic Analysis (BEA) said on Monday that core PCE, excluding food and energy, the Federal Reserve primary inflation gauge, came in at 1.57% in July on year-on-year basis, down from a 1.59% increase in June and a 1.64% gain in May. Both sets of data were weak, as the nonfarm payrolls data shows signs of slowing down and the core PCE index is still running below the Fed’s target of 2%.

The U.S. Bureau of Labor Statistics (BLS) said on Friday that U.S. total nonfarm payrolls increased by a seasonally adjusted 151,000 jobs last month, missing Wall Street economists' forecast of an 180,000 gain. Both the U-3 and U-6 unemployment rates remained at 4.9% and 9.7%, respectively. The change in total nonfarm payrolls employment for June was revised down from +292,000 to +271,000, and the change for July was revised up from +255,000 to +275,000. The total nonfarm payrolls growth reflects the weak U.S. GDP for the first-half 2016, which was below 1%, due in part to the Fed rate hike in December 2015.

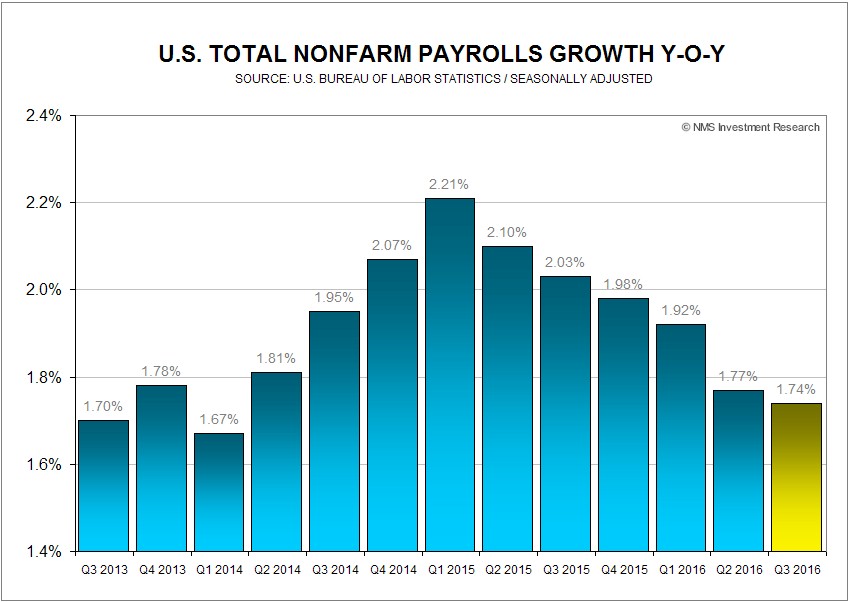
The BLS also said that the total seasonally adjusted nonfarm payrolls, as of August 2016, stands at 144,598 million. If 213,000 jobs, the average of July and August, are added for September, total nonfarm payrolls growth will be 1.74% year-on-year for the third-quarter 2016, the slowest since the second-quarter 2014. One can argue that slow growth in total nonfarm payrolls could be due to lack of qualified workers as the labor market approaches maximum employment, which is vaguely defined by the Fed.

The labor force participation rate remained at 62.8%, since some 94.4 million Americans were not in the labor force in August. From the household survey, the number of persons who are not in the labor force but want a job now registered at 5.83 million, meaning the unemployment rate would be 8.6% if this group of persons was considered as unemployed.

There was more bad news for the U.S. economy during the week, as the Institute of Supply Management (ISM) manufacturing index surprisingly came in on Thursday at 49.4, missing the estimate of 52, and down from 52.6 in July. The index reading below 50 indicates contraction. The ISM said new orders, order backlogs, and employment, all shrank.

The U.S. Dollar index inched up 0.32% for the week, to close on Friday at 95.844, as some Fed officials continue to insist on September rate hike, while the yield of the 10-year U.S. Treasury Note declined 1.23% to close at 1.60% on Friday. The yield spread between the 10-year and 2-year U.S. Treasury Notes widened to 0.8 percentage points at the close on Friday, a level not seen since November 2007. 

The probability of a 25 basis point rate hike at the next FOMC meeting on September 21 dropped 3 percentage points, to 21.0%, after the release of the employment situation report on Friday, while the probability of a no change in monetary policy rose to 79.0%, based on the CME Group 30-day Fed Fund futures prices as of September 2.

The WTI crude spot price tumbled another 6.72% for the week, to close on Friday at $44.44 per barrel, while Brent crude tanked 6.24% to close at $46.61 per barrel, after a Reuters survey showed on Wednesday that OPEC's oil output in August is likely to set another record high, as extra barrels from Saudi Arabia and other Gulf members make up for losses in Nigeria and Libya. 

According to OilPrice.com, OPEC increased their crude production in August by 40,000 barrels per day (bpd) over July to a record-level of 33.5 million bpd. The crude prices, however, bounced off an intra-week low on Friday after Russian President Vladimir Putin called on oil producers to agree to limit output when OPEC members meet in Algeria on September 26.

The EIA weekly U.S. oil inventory report on Wednesday showed an increase of 2.3 million barrels to 525.9 million barrels, excluding the Strategic Petroleum Reserve, in the week ending August 26, compared to S&P Global Platts analysts’ expectations for a rise of 600,000 barrels. The American Petroleum Institute (API) inventory data on Tuesday showed a U.S. crude inventory build of 940,000 barrels for the week. 

Separately, the EIA said the weekly U.S. crude oil production decreased by 60,000 bpd for the week ending August 26, 2016, to 8.488 million bpd. Weekly U.S. crude oil output has fallen about 11.68% from the peak level of 9.61 million bpd during the week ending June 5, 2015. Houston-based oilfield services company Baker Hughes Inc. said on Friday that the U.S. oil rig count rose by 1 to 406, compared to 316, when the rig count hit the low on June 6, 2016. 

The best performing S&P 500 sectors for the week were Financials and Materials, up 1.96% and 0.95%, respectively. The worst performing sectors for the week were Healthcare and Energy down 0.57% and 0.56%, respectively. 

S&P 500 Summary: +6.66% YTD as of 09/02/16
Barclay Hedge Fund Index: +3.51% YTD 

Outperforming Sectors: Telecommunication services +15.54% YTD, Utilities +13.87% YTD, Energy +13.36% YTD, Materials +12.52% YTD, Industrials +9.73% YTD, Information technology +9.30% YTD, and Consumer staples +8.07% YTD.

Underperforming Sectors: Consumer discretionary +3.17% YTD, Financials +2.72% YTD, and Healthcare +0.57% YTD.

S&P 500 ANALYSIS

Most Recent Articles  |  Older Articles            

 Infotix Systems, Inc. -  NMS (Not Main Street) Research - privacy & security policy
All rights reserved