S&P 500

S&P 500 Decouples From Crude Oil Prices While Wall Street Strategies Shift as the U.S. Economy Could Get Worse in the Second-Half

Witawat (Ed) Wijaranakula, Ph.D.
Fri Jul 22, 2016

The S&P 500 inched up 0.61% for the week, to close at 2,175.03, despite that the WTI crude oil spot price tumbled 4.52% for the week to close on Friday at $44.19 per barrel, and Brent crude prices took a 4.26% nosedive to close at $46.06 per barrel. A bearish report from the Energy Information Administration (EIA) showed that U.S. demand for gasoline is weak, while OPEC and Russia continue to extend the bear market for crude oil. About 50% of total U.S. liquid fuels consumption is gasoline. 

The weak U.S. economy could also start impacting high-end fast casual dining. That includes Starbucks, as the company reported on Thursday that its same-store sales for fiscal third-quarter 2016 rose only 4%, a steep slowdown from the 7% same-store sales growth delivered in the preceding quarter. Starbucks CEO Howard Schultz called the slowdown in the U.S. an "anomaly". 

The S&P 500 has decoupled from WTI crude price since June 24, after the Brexit vote, as traders are rotating out of the Energy sector and piling into the Information technology and Healthcare sectors. The best performing S&P 500 sectors for the week were Information technology, Utilities, and Healthcare, up 2.02%, 1.46%, and 1.24%, respectively. The worst performing sectors for the week were Industrials and Energy, down 0.80% and 1.31%, respectively.

The dollar bulls continued to take the U.S. Dollar index to a four-month high at 97.516 on Friday, up 0.99% for the week. The yield of 10-year U.S. Treasury Note bounced off the record low of 1.37% on July 8, to close at 1.57% on Friday. The yield spread between the 10-year and 2-year U.S. Treasury Notes tumbled 3.37% for the week, to close at 0.86 percentage points, as the probability of a 25 basis point rate hike at the next FOMC meeting on July 27 inched up to 2.4%, while the probability of a no rate hike dropped to 97.6%, according to data from the CME Group as of July 22.The global bond markets continued to be rattled from global uncertainty, as the 10-year Japanese government bond (JGB) yield stayed at negative 0.224% at the close on Friday, while the 10-year German bund yield is back to negative 0.023%. 

The EIA weekly U.S. oil inventory report on Wednesday showed a decline of 2.34 million barrels to 519.5 million barrels, excluding strategic inventories, in the week ending July 15, compared to S&P Global Platts analysts’ expectations for a drawdown of 1.25 million barrels. The American Petroleum Institute (API) inventory data on Tuesday showed a U.S. crude inventory draw of 2.3 million barrels for the week. 

There was another large build last week in U.S. gasoline supplies of 900,000 barrels, while distillate stockpiles, including jet fuel, diesel fuel and heating oil, dropped 200,000 barrels, according to the EIA. Analysts were expecting the gasoline stocks to remain unchanged and a rise of 700,000 barrels for distillates.

Separately, the EIA said the weekly U.S. crude oil production decreased by 9,000 barrels per day (bpd) for the week ending July 15, 2016, to 8.494 million bpd. Weekly U.S. crude oil output has fallen about 11.61% from the peak level of 9.61 million bpd during the week ending June 6, 2015. Houston-based oilfield services company Baker Hughes Inc. said on Friday that the U.S. oil rig count was up another 14 from the previous week, to 371, compared to 316, when the rig count hit the low on June 6. 

There are still no discussions between OPEC and Russia about oil output after a failed attempt to jointly maintain production levels earlier this year. OPEC’s monthly report stated that Saudi Arabia’s crude oil production rose by 66,500 bpd, to 10.3 million bpd in June 2016, compared to the previous month, while Iran’s crude oil production rose by 77,800 bpd, to 3.64 million bpd in June 2016, compared to May 2016. Iran almost doubled its exports since early 2016. Russia’s crude oil production also rose to 10.8 million bpd in June 2016, compared to the previous month, according to the Russian Energy Ministry.

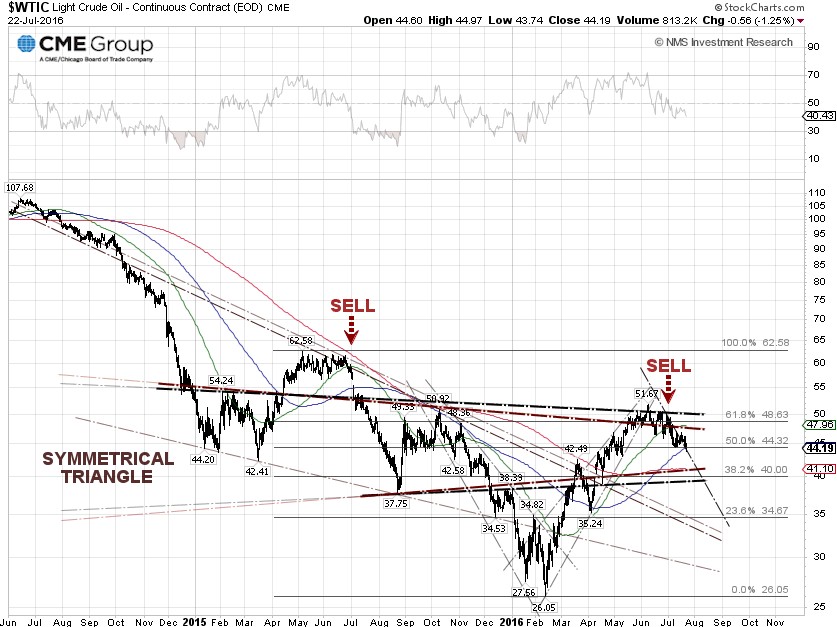
Technically, the WTI crude price broke down the $44.32 support, or the 50.0% Fibonacci retracement level, as demand remains soft. The next support is the $40.00 per barrel level, or 38.2% Fibonacci retracement. The EIA cut U.S. oil demand on July 12 to 160,000 bpd in 2016, compared with previous expectations for 220,000 bpd. If the $40.00 level can’t hold, the next support is $34.67, or the 23.6% Fibonacci retracement level.

U.S. economic data released this week were mixed. The global financial information and services firm Markit, said on Friday that its July U.S. Manufacturing Flash Purchasing Managers' (PMI) Index rose to 52.9 from 51.3 in June. A PMI reading above 50 indicates expansion in the sector. This reading was better than the analyst consensus estimate of 51.6, according to a Thomson Reuters poll. 

The U.S. Manufacturing PMI has been in a downtrend since it peaked at 57.3 in June 2014 and bottomed at 50.5 in May 2016. Markit chief economist, Chris Williamson said, “It remains too early to say if this is the start of a stronger upturn, but this is a welcome and encouraging sign of revival after the second quarter, in which the PMI signaled the sector’s worst performance for over six years.”

Also released on Friday was the July Philadelphia Federal Reserve’s index of business conditions, or Philly Fed, which came in at negative 2.9%, compared to the positive 3.5 expected by economists polled by MarketWatch. This is the ninth month of declining activity in the past eleven months, and the slowest pace in six months.

Last Friday, the Federal Reserve said U.S. industrial production rose a seasonally adjusted 0.6% in June, beating the 0.4% forecasted rise from economists surveyed by The Wall Street Journal. Separately, the Federal Reserve Bank of New York also said last Friday that its Empire State manufacturing index tumbled to a reading of 0.55 in July, missing the forecast of 5.0. Any reading above zero points to expansion.

It could be make-or-break next week for the Fed, as the U.S. Bureau of Economic Analysis will release the second-quarter GDP (advance estimate) on July 29. The current GDP forecast by the Federal Reserve Bank of New York is 2.2%, the lowest second-quarter GDP since 2014. Lindsey Piegza at Stifel told Sara Eisen on CNBC this week that things can get worse in the second-half, because corporations continue to rein investment spending.

The U.S. dollar is now at an artificially high level, which could trigger capital flows into the long-maturity bond market. The 2-year Note yield is about to break out the 0.74% level, which could also mean that traders are selling the short-maturity bonds and moving into the 10-year Note, as the market believes that further Fed rate hikes will crash the U.S. economy. 

S&P 500 Summary: +6.41% YTD as of 07/22/16
Barclay Hedge Fund Index: +0.72% YTD 

Outperforming Sectors: Telecommunication services +22.59% YTD, Utilities +20.03% YTD, Energy +14.36% YTD, Materials +11.43% YTD, Consumer staples +9.62% YTD, and Industrials +9.27% YTD.

Underperforming Sectors: Information technology +4.92% YTD, Consumer discretionary +4.37% YTD, Healthcare +4.04% YTD, and Financials –0.77% YTD.

S&P 500 ANALYSIS

Most Recent Articles  |  Older Articles            

 Infotix Systems, Inc. -  NMS (Not Main Street) Research - privacy & security policy
All rights reserved