|
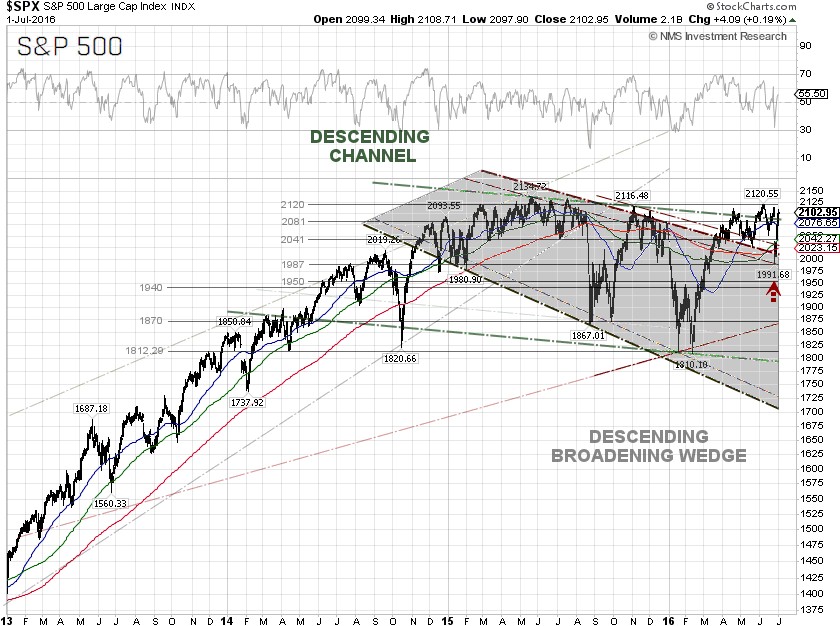
The S&P 500 bounced off the trendline supports and surged 3.22% for the week, to close at 2,102.95 on Friday, after the market realized that the Brexit will take years to resolve and the sell-off was a good buying opportunity. The probability of a rate cut at the July 27 FOMC meeting, based on the 30-day prices of federal funds futures, jumped from 1.2% to 2.4%, while the probability of a no rate hike stands now at 97.6%, according to data from the CME Group as of July 1.
Ironically, Cleveland Fed President Loretta Mester, a voting member of the
FOMC, said in a speech to a business group in London on Friday that, “Waiting too long increases risks to financial stability and raises the chance that we would have to move more aggressively in the future, which poses its own set of risks to the outlook.” Since the Fed raised the interest rate in December 2015, the yield of 10-year U.S. Treasury Notes has tumbled over 36%, from 2.28% to 1.46%. More rate hike talk could send the 10-year U.S. bond yield even lower, as recession fear rises.
The IMF said last Wednesday that it slashed the U.S. GDP to 2.2% this year, down from its 2.4% forecast in April. The fund, however, kept its forecast for 2017 at 2.5%, but said that the Federal Reserve should stay its hand on interest rates for a while, according to the Wall Street Journal. IMF economists said a strong dollar could remain a problem for the U.S., as the dollar is 10-20% higher than economic conditions warrant.
The Commerce Department said on Tuesday that it revised the U.S. first-quarter GDP to an annual rate of 1.1% from 0.8%, reported last month, citing positive contributions from personal consumption expenditures
(PCE), residential fixed investment, state and local government spending, and exports.
Markit said on Friday that its final U.S. Manufacturing Purchasing Managers Index
(PMI) came in at 51.3 in June, down marginally from the preliminary reading of 51.4. A reading above 50 indicates expansion in the manufacturing sector and a reading below 50 indicates contraction. Separately, the Institute for Supply Management (ISM) said its index of national factory activity rose to 53.2, exceeding expectations of 51.4 from a Reuters poll.
For the week, the U.S. dollar index inched up 0.15%, to close at 95.72 on Friday. The yield of 10-year U.S. Treasury Notes tumbled another 7.01% for the week to close at 1.46%, a level not seen since mid-2012. There is a support at 1.43%, or the July 25, 2012 low. The yield spread between the 10-year and 2-year U.S. Treasury Notes tumbled over 8.6% on Monday, to close at 0.85 percentage points, a level not seen since late 2007. The global bond markets are rattled, as the 10-year Japanese government bond
(JGB) yield dropped to negative 0.253% at the close on Friday, while the 10-year German bund yield printed at negative 0.126%, both near record lows.
The best performing S&P 500 sector for the week was again Telecommunication services, up 4.11%, while the worst performing sector for the week was also again Materials, up only 0.57%.
Since August 2015, the S&P 500 has been positively correlated with the WTI crude oil price. Traders, including algorithmic and high-frequency traders (HFT), may be creating greater profit opportunities by coupling the volatility and price swings in the crude oil futures market with the S&P 500 index.
The WTI crude oil spot price was up 3.59% for the week, closing at $49.28 per barrel on Friday, while the Brent crude price was up 4.56% for the week to close at $50.65 per barrel, after bullish weekly crude oil inventory reports and a looming strike by Norwegian oil workers threatened to cut output from Europe’s largest oil producer by up to 6%.
The Energy Information Administration (EIA) weekly U.S. oil inventory report on Wednesday showed a decline of 4.1 million barrels to 526.6 million barrels in the week ending June 24, compared to analysts’ expectations for a drawdown of 2.4 million barrels. The American Petroleum Institute (API) inventory data on Tuesday showed U.S. crude inventories fell another 3.9 million barrels for the week.
Separately, the EIA said the weekly U.S. crude oil production decreased by 55,000 barrels per day (bpd) for the week ending June 24, 2016, to 8.622 million bpd. Weekly U.S. crude oil output has fallen about 10.28% from the peak level of 9.61 million bpd during the week ending June 6, 2015. Houston-based oilfield services company Baker Hughes Inc. said on Friday that the U.S. oil rig count was up 11 from the previous week, to 341, compared to 316, when the rig count hit the low on June 6.
S&P 500 Summary: +2.89% YTD as of 07/01/16
Barclay Hedge Fund Index: +1.48% YTD
Outperforming Sectors: Telecommunication services +22.64% YTD, Utilities +21.16% YTD, Energy +14.80% YTD, Consumer staples +8.65% YTD, Materials +6.27% YTD, and Industrials +5.56% YTD.
Underperforming Sectors: Consumer discretionary +0.79% YTD, Healthcare +0.12% YTD, Information technology –1.04% YTD, and Financials –4.67%
YTD. |