S&P 500

S&P 500 Ends Final Trading Week of the Year With a Negative Note as Obama’s Russian Sanctions Jolt the Market

Witawat (Ed) Wijaranakula, Ph.D.
Fri Dec 30, 2016

The S&P 500 sold off 1.10% during the final week of the year, to close on Friday at 2,238.83, after the National Association of Realtors said on Wednesday that pending home sales dropped 2.5% in November, missing the forecast of a 0.5% gain. More selling continued on Thursday and Friday, following President Barack Obama’s announcement for new Russian sanctions over alleged cyberattacks and attempts to influence the U.S. presidential election. UBS Financial Services Floor Operations Director Art Cashin told CNBC on Thursday that the market likely overreacted to the White House decision.

The best performing S&P 500 sectors for the week were Real Estate ($SPRE) and Utilities ($SPU), up 1.10% and down 0.20%, respectively, while the worst performing sectors for the week were Information Technology ($SPT) and Financials ($SPF), down 1.45% and 1.41%, respectively. The S&P 500 Real Estate sector outperformed the broader S&P 500 index this week after the data for the S&P CoreLogic Case-Shiller Indices for October, released on Tuesday, showed that U.S. home prices continued to rise across the country over the last 12 months.

The S&P 500 Information Technology sector was led to the downside by Microsoft (NASDAQ:MSFT), Facebook (NASDAQ:FB), and Alphabet (NASDAQ:GOOGL), which were down 2.22%, 2.0% and 2.15%, respectively, for the week on high valuation and growth concerns. The Financials sector was dragged down by the flattening yield curve, as the yield spread between the 10-year and 2-year U.S. Treasury Notes tumbled 6.02% for the week. 

For the week, the U.S. Dollar index (DXY), essentially the USD/EUR exchange rate, declined 0.64% for the week to close at 102.29 on Friday. The DXY index was up 3.59% for the year. The yield of 10-year U.S. Treasury Notes tumbled 3.92% this week to close at 2.45% on Friday, while the yield spread between the 10-year and 2-year U.S. Treasury Notes narrowed to 1.25 percentage points. The 10-year JGB yield tumbled 10.91% to 0.049% at the close on Friday, while the 10-year German bund yield dropped 6.3%, to close at 0.208%.

Looking ahead, the U.S. economy still looks weak as the Federal Reserve Bank of New York forecast for the fourth-quarter 2016 U.S. GDP and the first-quarter 2017 U.S. GDP stands at just 1.8% and 1.7%, respectively. Taking the latest New York Fed forecast into account, the pace of U.S. GDP 2016 annual growth will be just 1.6% year-on-year, the slowest annual growth in 8 years. The U.S. economy has grown at a compounded annual growth rate (CAGR) of 2.08%, since the deep recession of 2009.

The WTI crude price gained 1.32% this week, up 44.9% for the year, to close at $53.72 per barrel on Friday, while the Brent crude spot price surged 3.01%, up 52.4% for the year, to close at $56.82 per barrel. The WTI crude price is bumping into a $53.96 resistance level, or 76.4% Fibonacci retracement, as the market is in a wait-and-see mode ahead of the OPEC and non-OPEC production cut of 1.8 million barrels per day (bpd), beginning in January 2017.

The EIA weekly U.S. oil inventory report on Thursday showed that domestic crude supplies rose by 614,000 barrels to 486.1 million barrels, excluding the Strategic Petroleum Reserve, in the week ending December 23, compared to The Wall Street Journal forecast for a stockpile decline of 1.2 million barrels. The American Petroleum Institute (API) inventory data on Wednesday showed a U.S. crude inventory increase of 4.2 million barrels. 

Separately, the EIA said the weekly U.S. crude oil production dropped 20,000 bpd for the week ending December 23, to 8.766 million bpd. Weekly U.S. crude oil output has fallen about 8.78% from the peak level of 9.61 million bpd during the week ending June 5, 2015. Houston-based oilfield services company Baker Hughes Inc. said on Friday that the U.S. oil rig count inched up 2 to 525, compared to 316, when the rig count hit the low on June 6, 2016. 

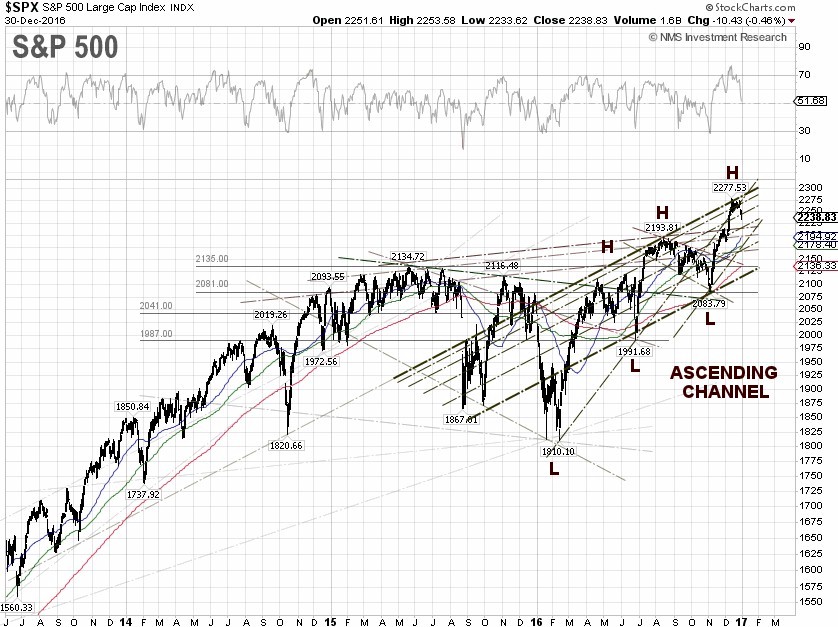
S&P 500 Summary: +9.54% YTD as of 12/30/16 
Barclay Hedge Fund Index: +6.30% YTD 

Outperforming Sectors: Energy +23.65% YTD, Financials +20.12% YTD, Telecommunication services +17.81% YTD, Industrials +16.08% YTD, Materials +14.08% YTD, Utilities +12.20% YTD, and Information technology +11.99% YTD.

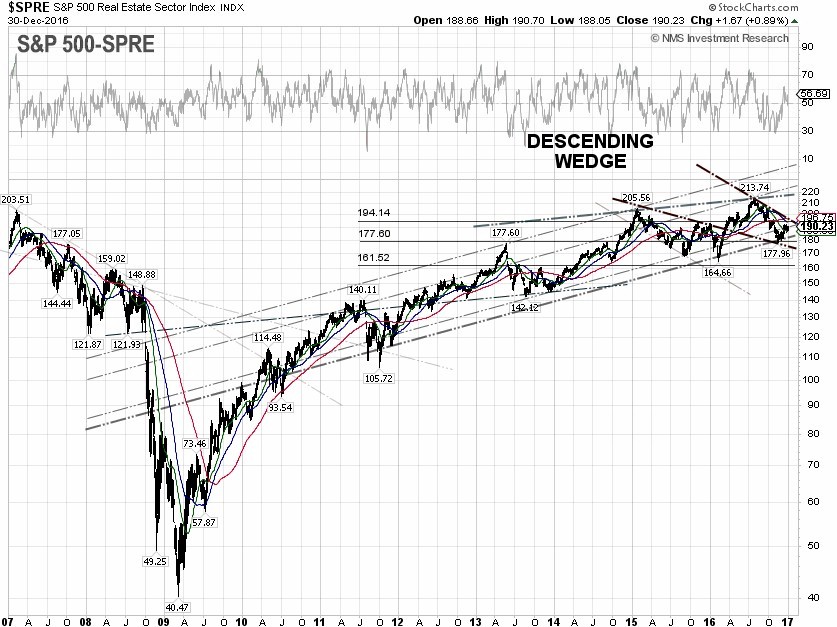
Underperforming Sectors: Consumer discretionary +4.32% YTD, Consumer staples +2.58% YTD, Real Estate +0.01% YTD, and Healthcare –4.36% YTD.

S&P 500 ANALYSIS

Most Recent Articles  |  Older Articles            

 Infotix Systems, Inc. -  NMS (Not Main Street) Research - privacy & security policy
All rights reserved