|
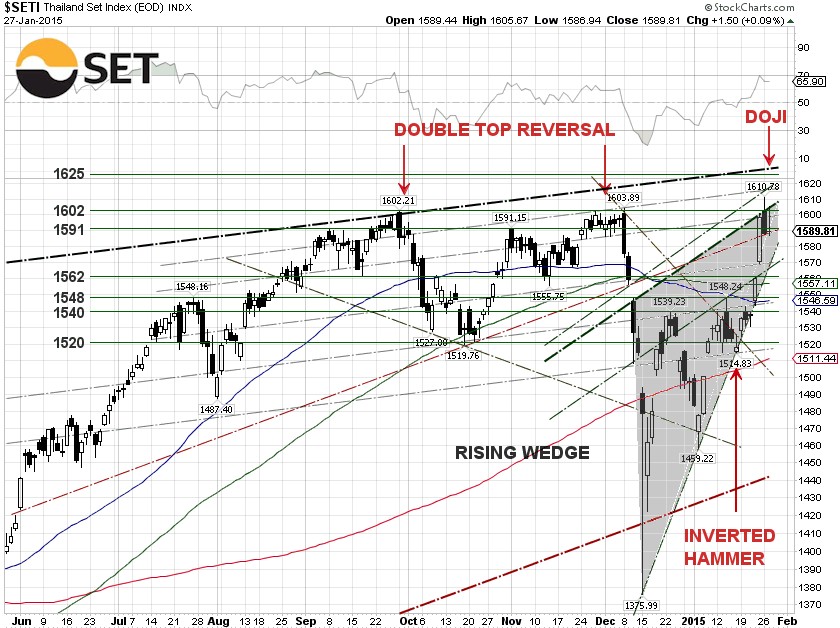
A doji just emerged in the SET chart pattern. Technically, when a stock opens and closes at almost the same price, a “doji”
candlestick, having a cross, inverted-cross or plus-sign shape, emerges in the chart pattern.
The doji occurred as the SET opened at 1589.44, just below the key resistance of 1591. Right after the opening, buyers slowly pushed the index higher to a resistance level of 1605.67. Sellers found that price level to be unjustified, stepped in and pushed the price lower.
The SET closed slightly up for the day at 1589.81, but practically at the same price as when it opened. A doji, particularly on the heels of a bearish market on the previous trading day, could signal a potential bearish trend reversal. Notably, the index closed below the 1591 technical support for the second day in a row.
For the next several trading days, one should pay close attention to these bearish trend reversal patterns, so manage risks accordingly. Again, it is important that the SET doesn’t break down the 1562 support level or pulls back off the 1602 head resistance.
In wake of a dismal U.S. durable goods report today, we think that the U.S. Federal Reserve meeting on Tuesday and Wednesday will be a non-event. The headline risk is now the Q4 U.S. GDP to be reported on Friday. So, tighten your seatbelts! |