|
The price of gold and the U.S. 10-year Treasury notes tumbled on Friday, sending the gold price down 1.22% to an intra-day low of $1,162.10 per ounce and the 10-year yield up 5.76% to an intra-day high of 2.442%, after the release of the May U.S. non-farm payroll report, which came in better than expectations.
The U.S. Bureau of Labor Statistics said that the U.S. government and private businesses added 280,000 jobs in May to the U.S. economy, above the 3-month average of 207,000 jobs and the 12-month average of 257,000 jobs, according to our data. More decent numbers like this in the June report could definitely trigger the first rate hike in September.
The gold price has been running out of stream since mid-May as it was unable to break out the $1,224 per ounce resistance level, after a big surge on May 13 when gold broke through the key resistance of $1,200 per ounce. The gold sell-off could be attributed directly to a surge in the U.S. Treasury yields as the correlation between the two of them is high. A lack of demand may be part of the falling gold price as the global gold jewelry demand for the first-quarter of 2015 declined 3% to 600.8 tons, according to the World Gold Council’s quarterly report.
As of June 2, there are 89,889 short positions for gold futures [COMEX:GC], by non-commercial dealers, compared to about 194,299 long positions, according to the Commitment of Traders (COT) data released by the Commodity Futures Trading Commission (CFTC) each Friday. Hedge funds and large speculators seemed to turn slightly bearish in the previous week as both long and short positions have increased 2,348 and 2,632 contracts, respectively, from last week, where gold contracts are traded in units of 100 troy ounces. Things could change if the hedge funds unwind their long positions.
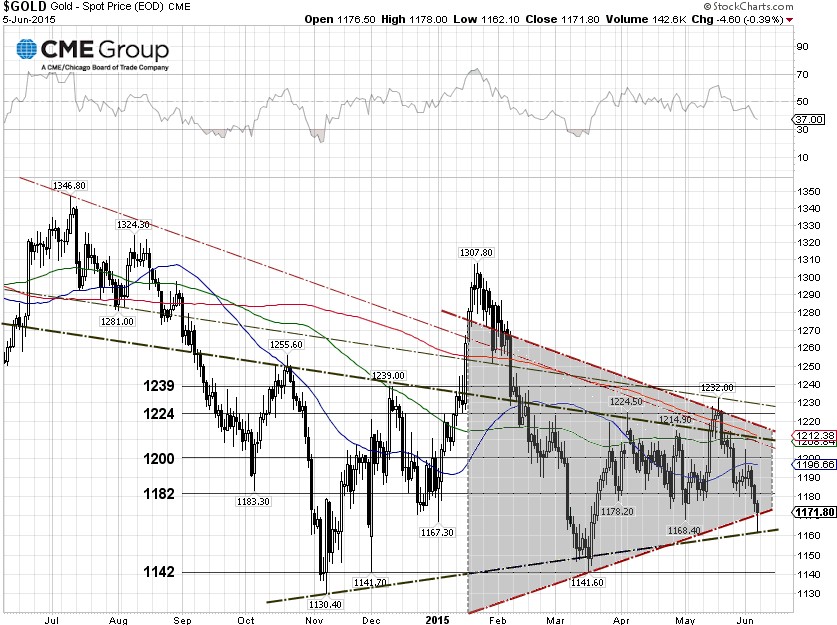
From our technical viewpoint, the gold price is moving in two symmetrical triangle chart patterns. On Friday, gold tested the lower trendline supports of both symmetrical triangles, at $1,161 per ounce and $1,171 per ounce, respectively. The next move for gold prices could depend upon the yield of the U.S. 10-year Treasury note. If the U.S. and the eurozone economy show more signs of sustainable recovery in the coming weeks, the 10-year Treasury yield could break out its trendline resistance at 2.41% and move higher to test the head technical resistances at 2.5% and 2.66%, or the 23.6% Fibonacci retracement level.
In the event that the 10-year Treasury yield breaks out, the gold price could pull back further. The near-term technical support for the gold price is $1,142 per ounce. Gold could turn very bearish if the price breaks down through the $1,142 per ounce level.
Here is what Barclays and UBS had to say about gold, according to the Bullion Desk. Barclays said that gold should increasingly face downward pressure as the summer is a seasonally slow period for demand. A near-term closing price below $1,170 could signal bearish technicals and a decline to $1,142.93, the low of March 17, according to UBS. It looks like both analyst firms are bearish on gold for the short-term.
|